Monitoring Key proxies to assess coastal system erosion​

The diversity of the coastal erosion indicators measurable from EO data, the frequency of monitoring adapted to all end-user expectations, and the accuracy achieved provide valuable and fundamental tools to help decision-makers mitigate coastal risks.

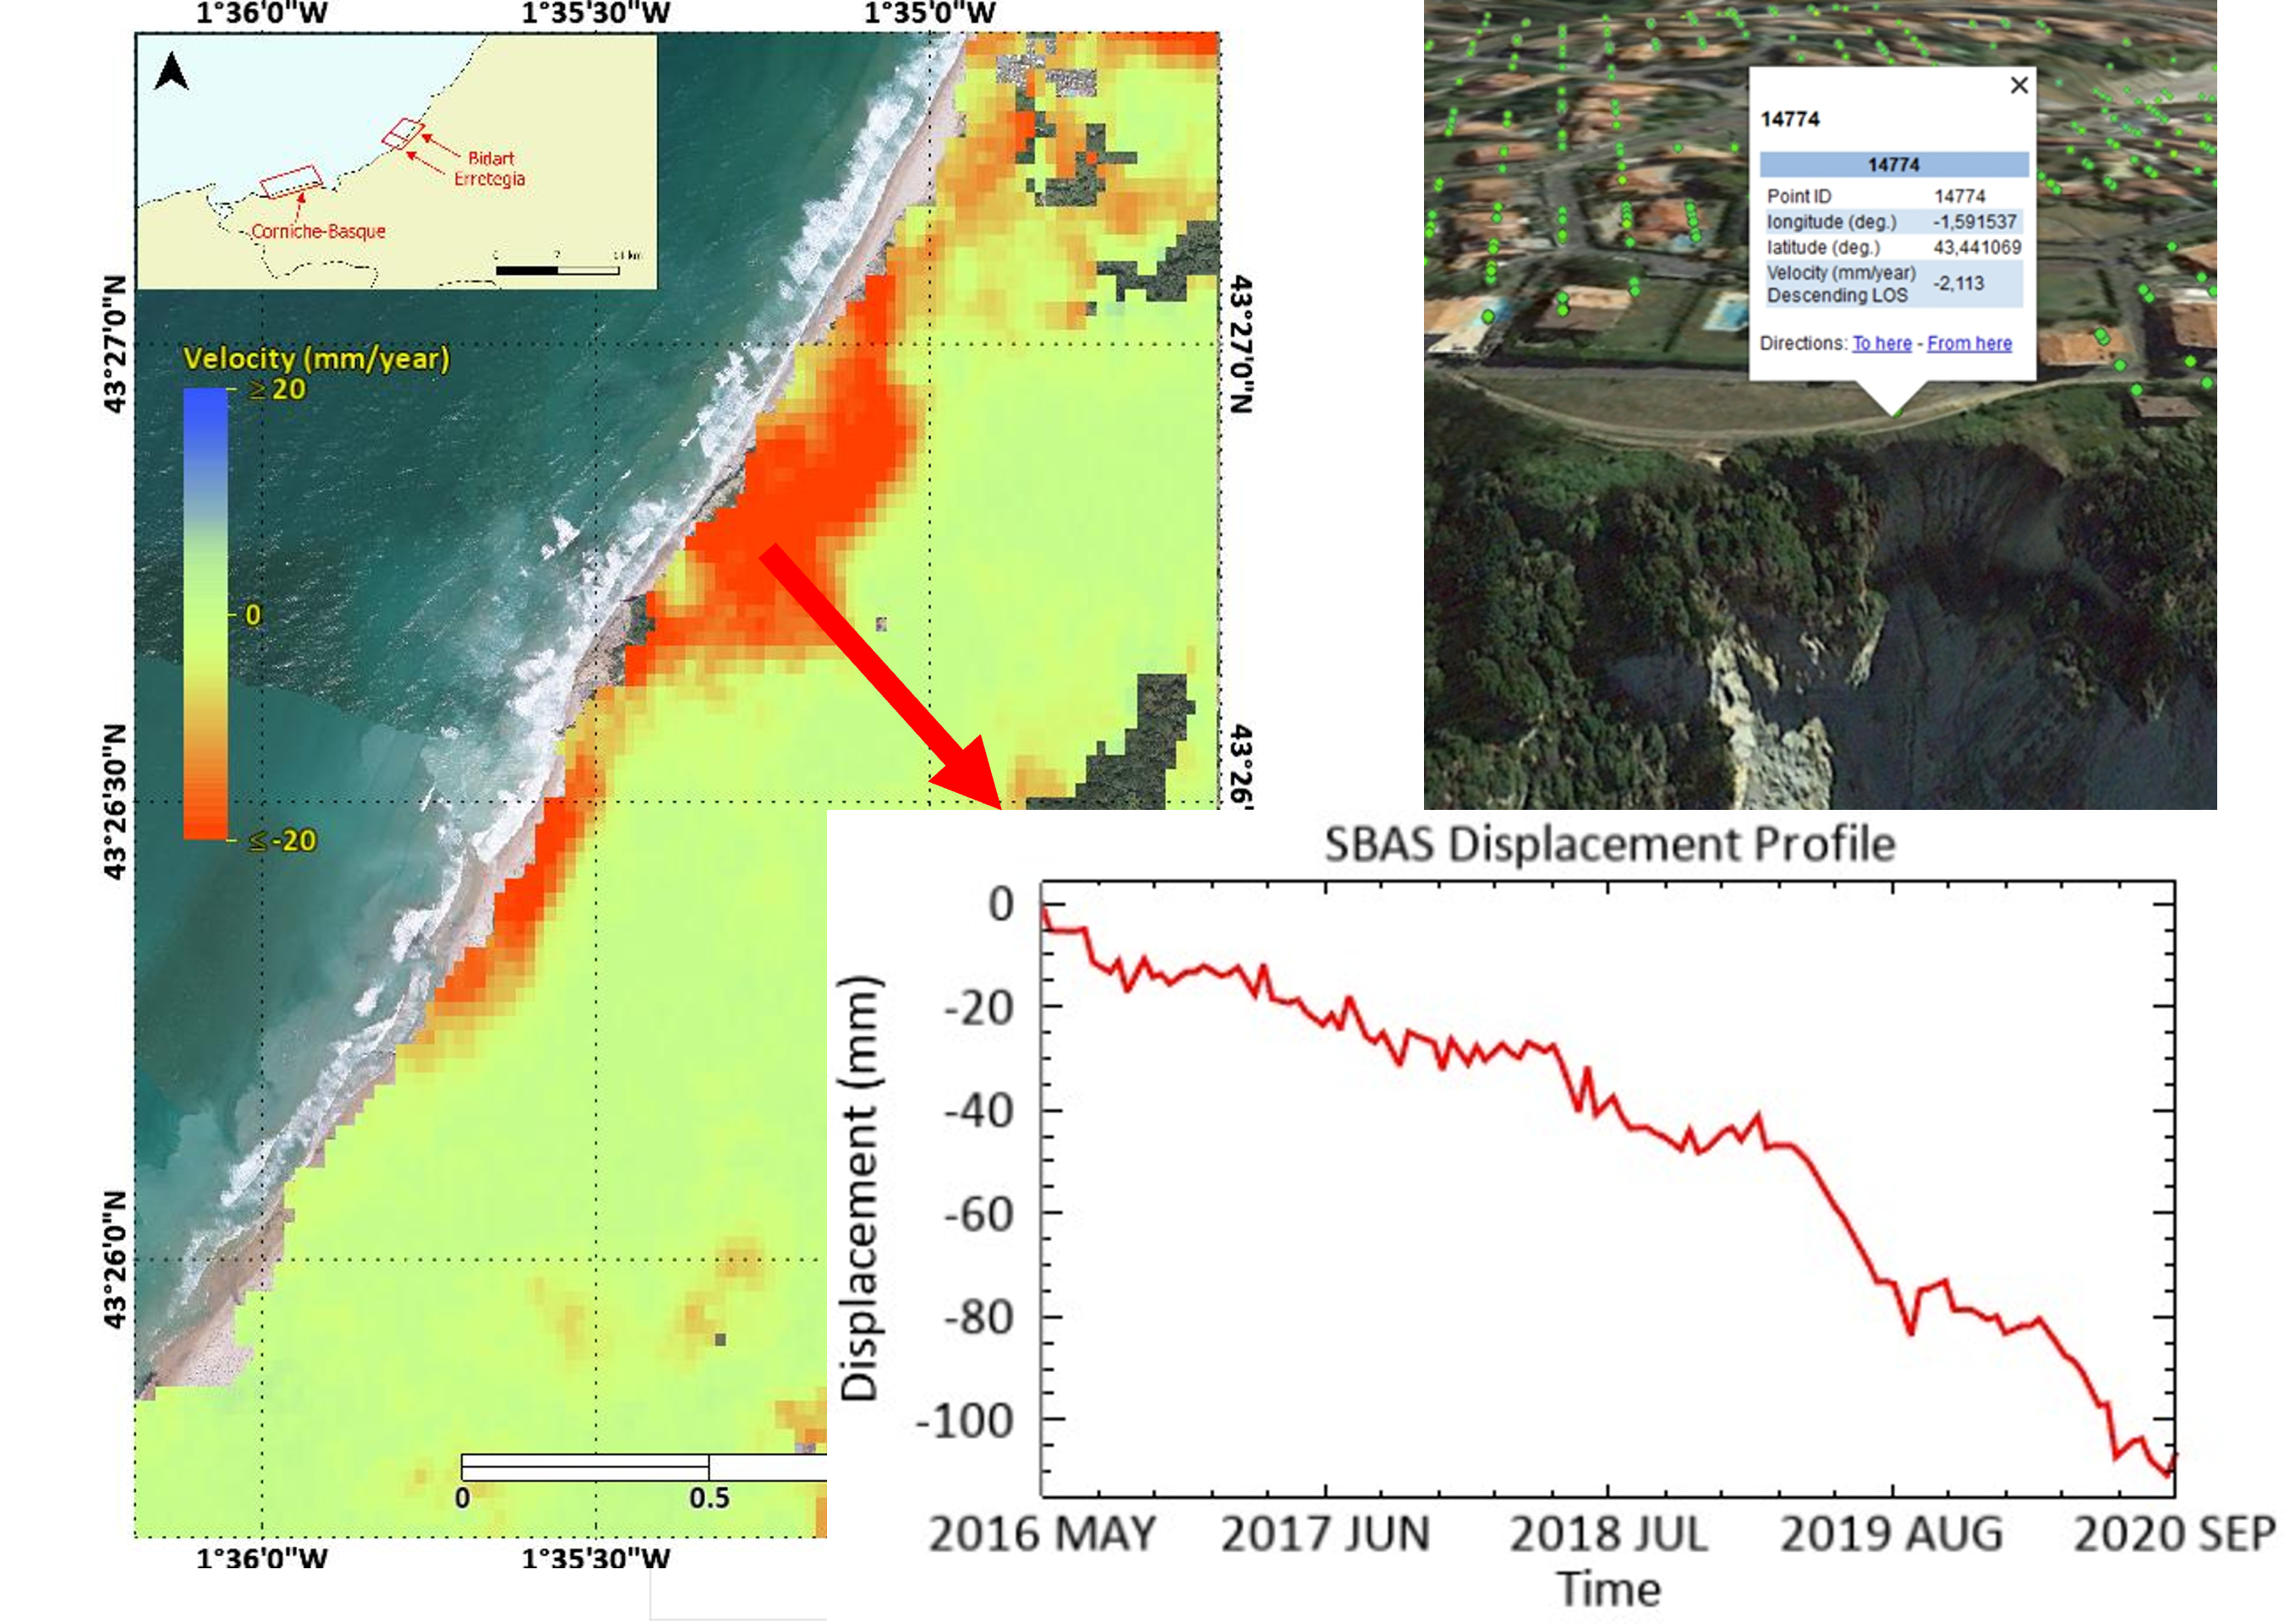
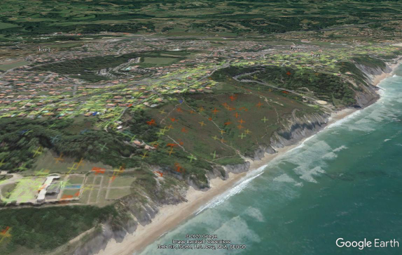
Earth Observation also provide support for communicating on the effects of coastal protection measures and to anticipate consequences of planned actions, one-off events such as storms, or the effects of climate change.

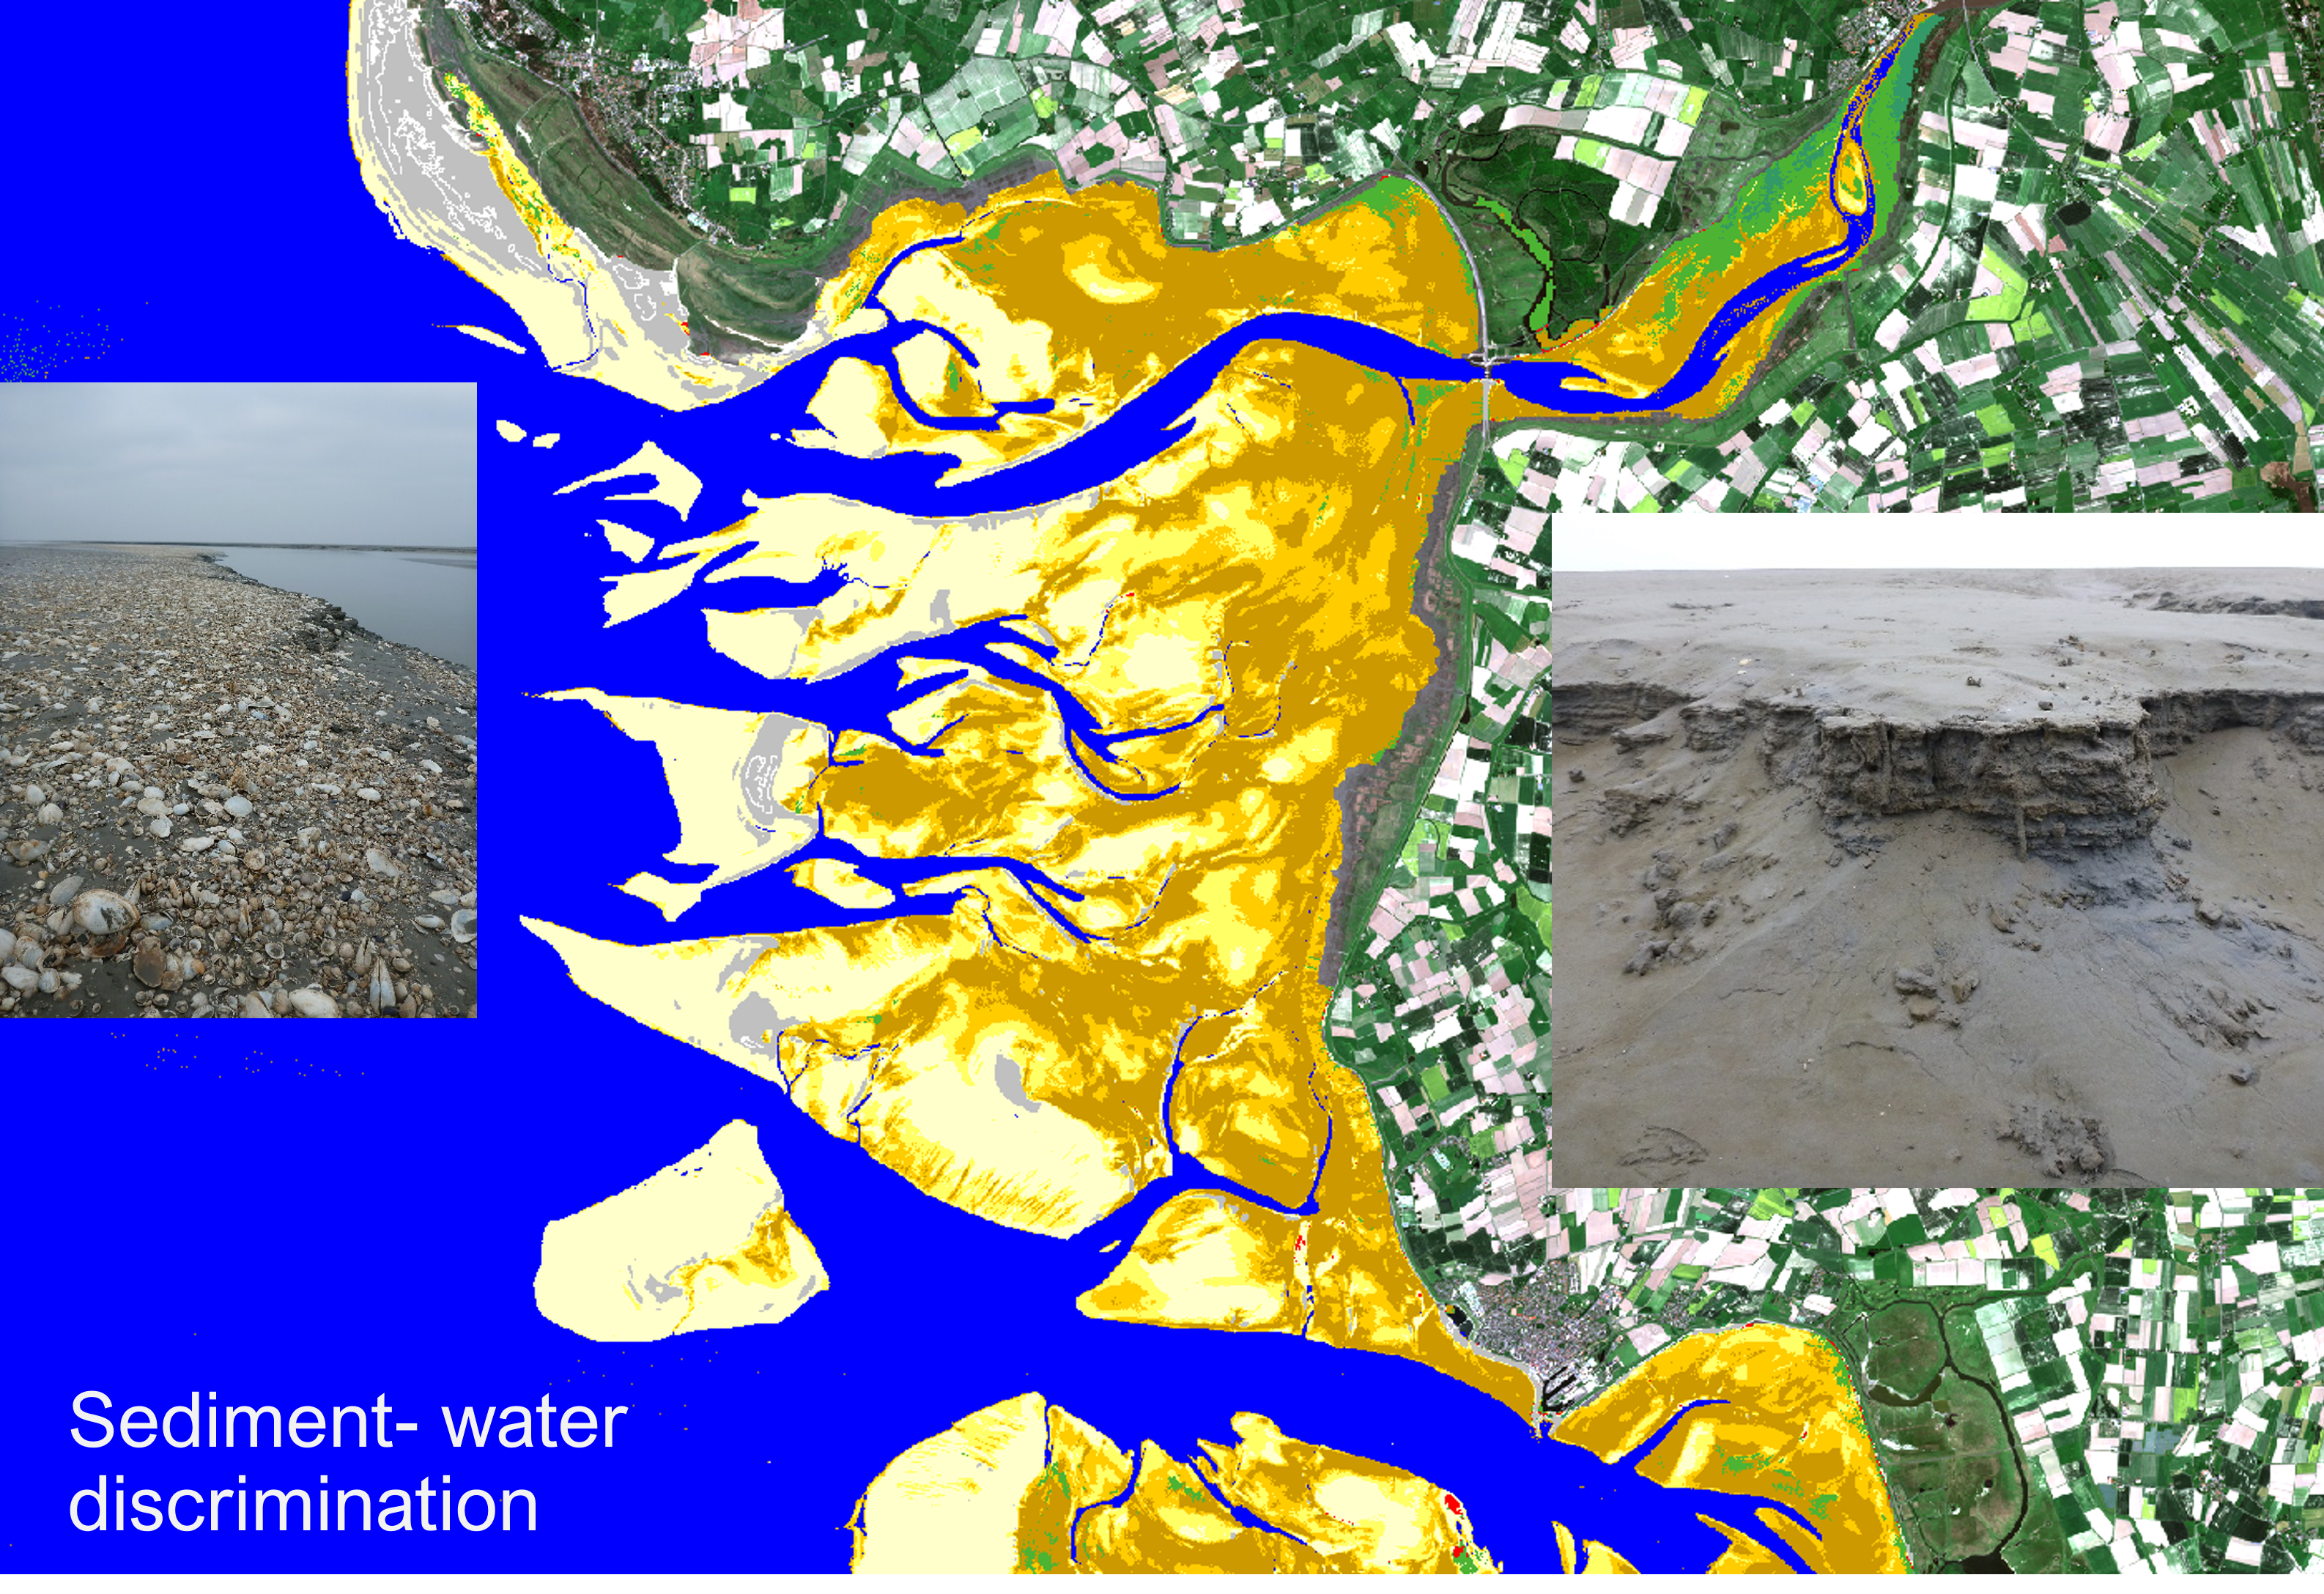
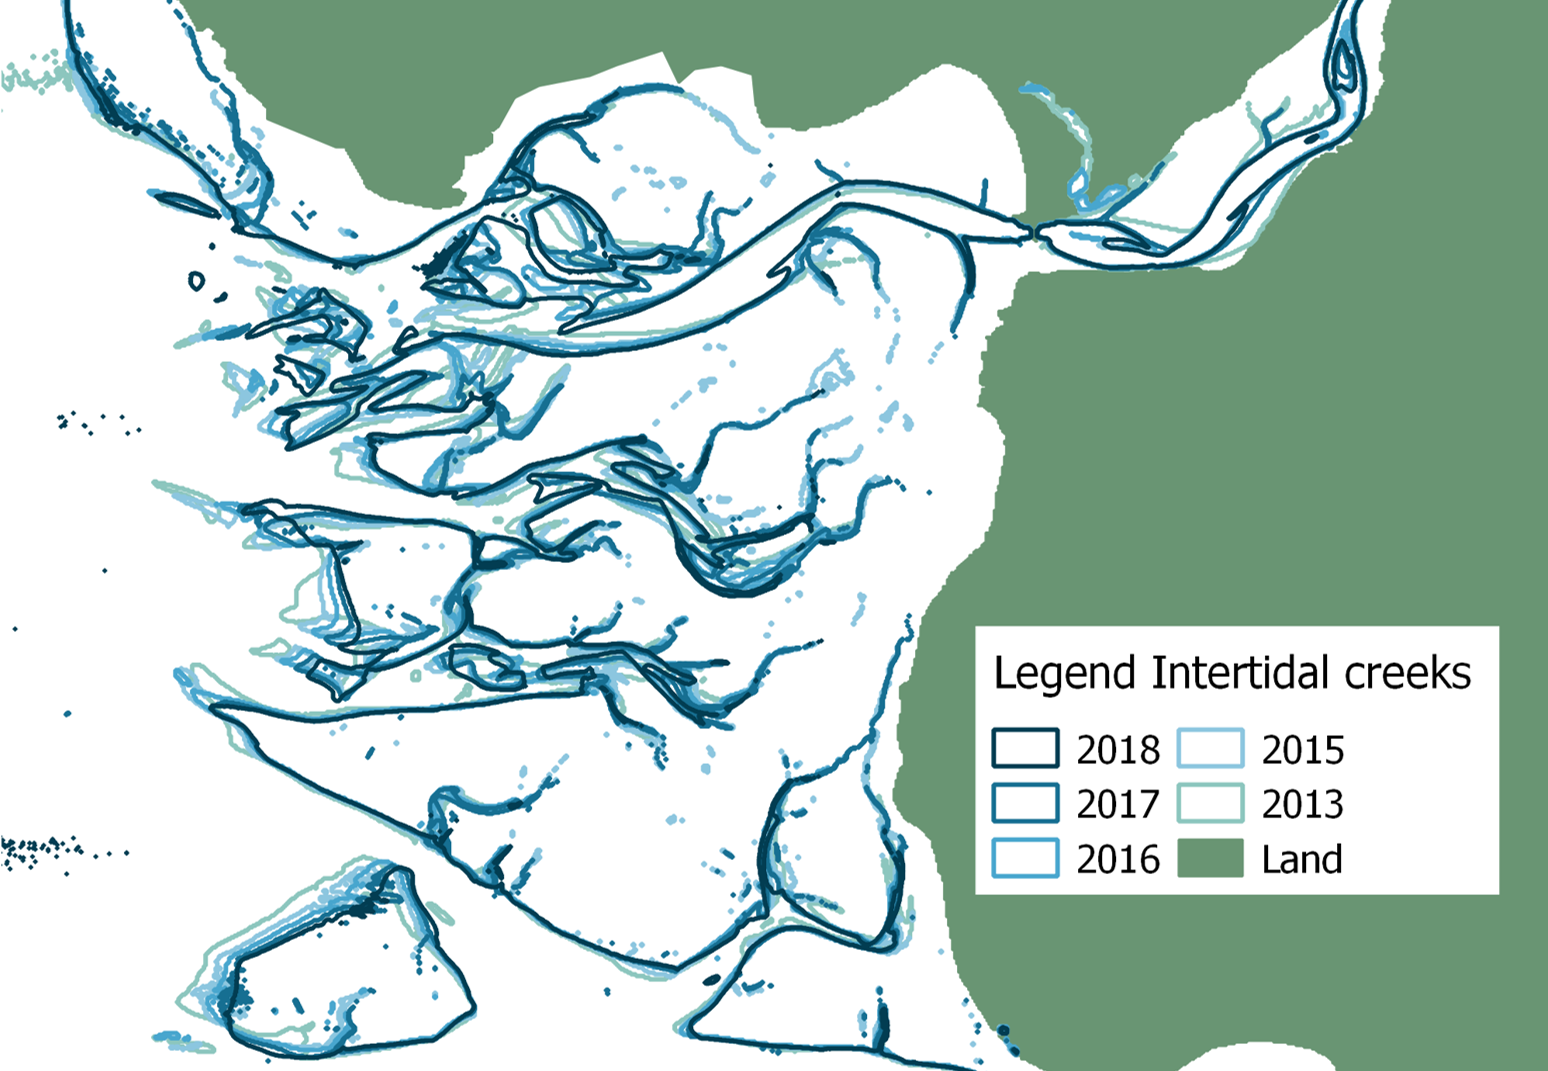
For the first time in Europe, a consortium of multidisciplinary experts with adequate background in the use of satellite remote sensing for coastal erosion proposes an EO-based packaged service suited for every kind of coastal areas.

Having proven that EO products are a relevant complement to field observations by providing new, reliable and crucial information that was lacking in many coastal areas around the world, the ESA Coastal Erosion initiative is likely to have changed the way coastal erosion monitoring is addressed.

Shoreline evolution

Hundreds of satellite images over the 1995-2020 period of time were processed to get information about the change in the waterline and shoreline positions over time. These are the main coastal erosion indicators, the acknowledgement of shoreline change computed over a long period of time (decades) serving basically as a coastal erosion assessment.

Waterline

The waterline represents the limit between the marine and terrestrial parts of the coastal system.

Over microtidal areas, the waterline is preferably monitored or extracted during low wave agitation conditions, in order to be relevant from one date to another and not to depend on sea level fluctuations due to wind/storm. This is the indicator that we usually favor for the study of trends in the evolution of the coastline.

Changes in the waterline position are computed and estimated along regularly spaced profiles perpendicular to the coast (but also in terms of area surface changes) highlighting hotspots of shoreline erosion which experience strong coastal dynamics or being particularly vulnerable to coastal erosion hazard.

Upper Swash Limit

The upper limit of the swash marks the highest position at which the water has reached on the beach for several months.

The upper swash limit is a hybrid indicator, developed to be assimilated to the monitoring shoreline usually instrumented by many coastal managers and scientists, notably in contexts of strong instantaneous fluctuation of the waterline over reflective beaches (steep). 

To overcome this bias, the dry/wet sand limit is preferred in the field, and can be easily extracted on a single very high resolution image (eg Pléiades, 0.5 m). In the use of high resolution spatial data (eg Sentinel, 10 m), the result is the product of a combination of waterlines extracted on images acquired over a very short period.

Dune foot

The dune foot is defined by a change in slope at the base of the seaward side of the dune.

On macrotidal sandy coasts where a coastal dune system is found, we monitor the position of the dune foot and its cross-shore dynamics as the main indicator of shoreline variation.


Even if the dynamics of the dunes are generally slower than those of the water lines in the intertidal zone, they are sometimes more spectacular, with retreats or even breaches in the dune system that can reach several tens of metres during a storm, which represents a massive movement of sediments.

Long-term trends and extreme events can be spatialised and quantified using satellite imagery and our tools. 

Tidal Creeks

Tidal creeks are structures of differential erosion related to the influence of marine waters during tidal cycles on the sandy-muddy sedimentary material. The creek edges mark the limits of these channels. 

Nearshore Dynamics

To overcome the planimetric approach induced by coastline position monitoring, and to assess the dynamics affecting the whole coastal system, we also placed a special focus on the detection of Nearshore dynamics.

Shallow-water bathymetry

Satellite-derived bathymetry was systematically computed over stretches of european coastlines.

This approach which is known to produce reasonnably accurate (below 50 cm of vertical accuracy) Digital Elevation Models in depths of 0-20m (depending on coastal water transparency) has been deployed in several locations in France, Portugal, Greece and Romania. Here is an example of satellite-derived bathymetry DEMs along the Camargue Rhone Delta region (80 km) over the last 25 years computed using only archives of Spot-4/5, Landsat-7/8 and Sentinel-2 data (no need of ground truth).

So then, in many coastal areas in Europe, changes in the nearshore bathymetry can be observed at relatively high frequency (in theory weekly using Sentinel-2, more realistically a couple of times a year) providing frequent observations of bottom changes at the scale of the coastal system or that of the sediment cell enabling the assessment of sediment stocks and their variation over the relevant timescales of coastal dynamics.

Coastal scientists and beach managers are all of one mind with regards to the benefits of satellite-derived bathymetry which provides routine easy-to-update information about the beach morphology and bathymetry at an  accuracy level almost equivalent to aerial Lidar techniques. And, in consequence, evidence of the natural fluctuations affecting the underwater sediment stocks at seasonal and annual time scales which is crucial information for the coastal manager in charge of the mitigation of beach and shoreline vulnerability.

Sandbar Dynamics

Sandbar positions were detected from satellite images to assess the dynamics of sedimentary stocks in front of sandy beaches.

Extraction of features from the underwater morphology as sand bank and sandbar migration over time is easily done from each individual satellite image. This combined information over time gives the envelope of sand bar variations across the beach profile, from inland to the underwater, and alongshore over hundreds of kilometers. Done on a routinely basis, this can be used as early warning for scientists or coastal managers highlighting any vulnerable position of underwater sandbars, or can help understand large-scale coastal erosion processes that may impact

Off-Shore Bathymetry

Satellite-derived bathymetry was also computed off-shore.

When the waves propagate from deeper to shallower water their wavelength decreases and their direction changes, and as a result these properties allow to infer sea bottom features. To complete the shallow-water bathymetry, the SAR use for swell inversion allows to derive the bathymetry in the higher energetic areas, more exposed to swell.

Thus, we can provide a continuum of bathymetric reconstruction, from shallow water (<1 m) to sea (> 50 m).

Rocky coasts

Rocky coastal areas are particularly challenging to address, as coastal cliffs are exposed to very little change on an annual basis, but in the meantime spectacular cliffside landslides can occasionally occur.

Vertical Ground Movement

Efforts have been made to raise awareness of the use of satellite remote sensing for cliff recession monitoring. The SAR Sentinel-1 dataset has been tested for cliff DEM reconstruction, with rather poor results compared to the expectations of coastal end-users, while SAR interferometry has provided valuable insights into vertical ground movements occurring at the cliff top. The use of Stereo-Pleiades for the reconstruction of high resolution cliff DEMs has revealed past and recent coastal landslides, which can then be associated with the presence of cliff slumps, which were detected from the Sentinel-2 time series.